MARA

TYPE Stocks
GROUP Stocks
BASE Marathon Dig...
SECOND
rate-up rate-down <% (signals.list.current.rate).substr(0,7) %>
<% (signals.list.current.absolute).substr(0,9) %> (<% signals.list.current.percentage|toFixed:2 %>%)
MARKETS TREND
OPEN
<% (signals.list.current.openrate).substr(0,9) %>
HIGH
<% (signals.list.current.high).substr(0,9) %>
LOW
<% (signals.list.current.low).substr(0,9) %>
MARA NEWSAll News
MARA Signals
DON'T WANT TO MISS ANY SIGNAL? GO PREMIUM
ACCESS ALL FX, COMMODITIES & CRYPTO SIGNALS. GO PREMIUM
<% signal.pair %> (<% signal.rate %>) <% signal.action %>
<% signal.status %>
Long Term
Entry Price
Stop Loss
Take Profit
<% signal.entryPrice %> N/A
PREMIUM ONLY
<% signal.stopLoss %> N/A
PREMIUM ONLY
<% signal.takeProfit %> N/A
PREMIUM ONLY
<% signal.comment %>
Description
<% signal.description %>
LATEST ANALYSIS
<% item.time_ago %> Ago
<% item.title %>
<% item.deltaTime %>

Last Updated: Jun 17, 2026 03:14:30 PM (GMT)

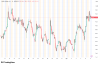
MARA: The current market price is 14.54, reflecting a percentage change of +1.68% from the previous price.

Support and Resistance Levels The pivot point is 14.29333, with support levels at 14.25667, 14.23333, and 14.19667, and resistance levels at 14.31667, 14.35333, and 14.37667.

Indicators The RSI is at 37.51 and is falling, suggesting bearish momentum. The ATR is 0.14507, indicating moderate volatility. The MACD shows a bearish trend with a MACD value of -0.06922, signal at -0.03354, and histogram at -0.03568. The Parabolic SAR is currently at 15.23, indicating a potential trend reversal.

Market Sentiment Price is above the pivot point (14.29333) but bearish indicators suggest caution before buying.

MARA Signals & Technical Analysis

Last Updated: <% indicators.interval.updated|date:'MMM d, y h:mm:ss a' %>
Market Trend
Strong Sell
Sell
Neutral
Buy
Strong Buy
Loading Market Trend ...

Market Sentiment

BUY: <% indicators.sentiment.buy.length %> SELL: <% indicators.sentiment.sell.length %> NEUTRAL: <% indicators.sentiment.neutral.length %>
Strong Sell
Sell
Neutral
Buy
Strong Buy

Trend Indicators

NAME
VALUE
ACTION
Bollinger Bands
UPPER: <% indicators.data[indicators.interval.active].bbands.value.upper %>
MIDDLE: <% indicators.data[indicators.interval.active].bbands.value.middle %>
LOWER: <% indicators.data[indicators.interval.active].bbands.value.lower %>
Sell
Buy
Parabolic SAR
<% indicators.data[indicators.interval.active].sar.value %>
Sell
Buy
Standard Deviation
<% indicators.data[indicators.interval.active].stddev.value %>
High Volatility
Low Volatility

Oscillators

NAME
VALUE
ACTION
RSI(14)
<% indicators.data[indicators.interval.active].rsi.value %>
Sell
Buy
MACD(12,26)
<% indicators.data[indicators.interval.active].macd.value %>
Buy
Sell
Neutral
ATR
<% indicators.data[indicators.interval.active].atr.value %>
High Volatility
Low Volatility
STOCH(9,6)
<% indicators.data[indicators.interval.active].stochastics.value %>
Buy
Sell
ADX
<% indicators.data[indicators.interval.active].adx.value %>
High Volatility
Low Volatility

Moving Averages

PERIOD
SIMPLE
EXPONENTIAL
MA5
<% indicators.data[indicators.interval.active].sma5.value %> Buy Sell
<% indicators.data[indicators.interval.active].ema5.value %> Buy Sell
MA10
<% indicators.data[indicators.interval.active].sma10.value %> Buy Sell
<% indicators.data[indicators.interval.active].ema10.value %> Buy Sell
MA20
<% indicators.data[indicators.interval.active].sma20.value %> Buy Sell
<% indicators.data[indicators.interval.active].ema20.value %> Buy Sell
MA50
<% indicators.data[indicators.interval.active].sma50.value %> Buy Sell
<% indicators.data[indicators.interval.active].ema50.value %> Buy Sell
MA100
<% indicators.data[indicators.interval.active].sma100.value %> Buy Sell
<% indicators.data[indicators.interval.active].ema100.value %> Buy Sell

Pivot

PIVOT
CLASSIC
FIBONACCI
CAMARILLA
WOODIE
S3
<% indicators.data[indicators.interval.active].pp.data.result.classic.s3 %>
<% indicators.data[indicators.interval.active].pp.data.result.fibonacci.s3 %>
<% indicators.data[indicators.interval.active].pp.data.result.camarilla.s3 %>
<% indicators.data[indicators.interval.active].pp.data.result.woodie.s3 %>
S2
<% indicators.data[indicators.interval.active].pp.data.result.classic.s2 %>
<% indicators.data[indicators.interval.active].pp.data.result.fibonacci.s2 %>
<% indicators.data[indicators.interval.active].pp.data.result.camarilla.s2 %>
<% indicators.data[indicators.interval.active].pp.data.result.woodie.s2 %>
S1
<% indicators.data[indicators.interval.active].pp.data.result.classic.s1 %>
<% indicators.data[indicators.interval.active].pp.data.result.fibonacci.s1 %>
<% indicators.data[indicators.interval.active].pp.data.result.camarilla.s1 %>
<% indicators.data[indicators.interval.active].pp.data.result.woodie.s1 %>
PP
<% indicators.data[indicators.interval.active].pp.data.result.classic.pp %>
<% indicators.data[indicators.interval.active].pp.data.result.fibonacci.pp %>
<% indicators.data[indicators.interval.active].pp.data.result.camarilla.pp %>
<% indicators.data[indicators.interval.active].pp.data.result.woodie.pp %>
R1
<% indicators.data[indicators.interval.active].pp.data.result.classic.r1 %>
<% indicators.data[indicators.interval.active].pp.data.result.fibonacci.r1 %>
<% indicators.data[indicators.interval.active].pp.data.result.camarilla.r1 %>
<% indicators.data[indicators.interval.active].pp.data.result.woodie.r1 %>
R2
<% indicators.data[indicators.interval.active].pp.data.result.classic.r2 %>
<% indicators.data[indicators.interval.active].pp.data.result.fibonacci.r2 %>
<% indicators.data[indicators.interval.active].pp.data.result.camarilla.r2 %>
<% indicators.data[indicators.interval.active].pp.data.result.woodie.r2 %>
R3
<% indicators.data[indicators.interval.active].pp.data.result.classic.r3 %>
<% indicators.data[indicators.interval.active].pp.data.result.fibonacci.r3 %>
<% indicators.data[indicators.interval.active].pp.data.result.camarilla.r3 %>
<% indicators.data[indicators.interval.active].pp.data.result.woodie.r3 %>

About (mara) Marathon Digital Holdings, Inc.

Company Background

Marathon Digital Holdings, Inc. (NASDAQ: MARA) is a leading digital asset technology company focused on mining cryptocurrency, with a particular emphasis on Bitcoin. Founded in 2010 and headquartered in Las Vegas, Nevada, Marathon has evolved into one of the largest publicly traded Bitcoin self-mining companies in North America. The company is committed to the efficient and scalable mining of digital assets while prioritizing a sustainable approach to energy use.

Market Position

Marathon Digital Holdings has carved out a significant position within the competitive cryptocurrency mining industry. As a pioneer in the space, the company leverages cutting-edge technology and strategic partnerships to enhance its mining operations. By optimizing mining efficiency and reducing costs, Marathon aims to capture a larger market share and establish itself as a top player in the cryptocurrency landscape. The company's focus on expanding its mining capabilities and infrastructure allows it to capitalize on the growing demand for Bitcoin and other digital assets.

Key Financial and Industry Highlights

As of 2023, Marathon Digital Holdings has reported impressive growth metrics, reinforcing its status in the digital asset sector. The company has significantly increased its Bitcoin production, positioning itself as one of the top producers in the U.S. In addition, Marathon's initiatives toward renewable energy usage align with global sustainability trends, enhancing its attractiveness to socially responsible investors. The company frequently updates its operational capacity and Bitcoin production metrics, showcasing transparency and commitment to shareholder value. Marathon's strategic investments in state-of-the-art mining hardware and energy agreements aim to bolster profitability and drive long-term growth. Furthermore, the cryptocurrency market's volatility presents both challenges and opportunities, positioning Marathon to capture significant returns as the market matures.

In summary, Marathon Digital Holdings, Inc. stands at the forefront of the digital asset revolution, leveraging innovation, sustainability, and strategic growth to reinforce its competitive edge in the cryptocurrency mining industry.

How to Buy or Trade Marathon Digital Holdings, Inc. Stock (MARA) with AvaTrade

Trading or investing in Marathon Digital Holdings, Inc. stock through AvaTrade starts with opening a verified trading account. After registration, complete the KYC verification process by submitting your ID and proof of address, then fund your account using a supported payment method such as bank transfer, debit card, or e-wallet. Once your funds reflect, log into the AvaTrade platform or mobile app and search for the ticker symbol MARA, which represents Marathon Digital Holdings, Inc.. Before placing a trade, review the live Marathon Digital Holdings, Inc. share price, market trend, spread, leverage options, and recent market news that could impact the stock price.

The next step is deciding whether you want to buy or sell Marathon Digital Holdings, Inc. stock. Traders expecting the price to rise typically open a Buy position, while traders expecting weakness in the sector may open a Sell position using CFDs. Enter your preferred trade size, then apply risk management tools such as a stop-loss to limit downside exposure and a take-profit order to secure profits automatically. After confirming the trade, monitor key drivers including Marathon Digital Holdings, Inc. earnings reports, product or service announcements, business segment performance, revenue growth, and overall stock market sentiment. Many traders also use technical indicators such as moving averages, RSI, and support/resistance levels available on the AvaTrade platform to improve timing and trading decisions.

Related Stocks

RIOT logo
RIOT
Riot Platforms, Inc.
0
Industry Financial - Capital Markets
Exchange NASDAQ
MS logo
MS
Morgan Stanley
0
Industry Financial - Capital Markets
Exchange NYSE
SF logo
SF
Stifel Financial Corp.
0
Industry Financial - Capital Markets
Exchange NYSE

HFM

HFM rest

Pu Prime

XM

Best Forex Brokers