
LLY

 <% (signals.list.current.rate).substr(0,7) %>
 <% signal.analyst %>

Last Updated: Jun 17, 2026 03:07:58 PM (GMT)
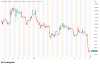
LLY: The current market price is 1114.9, showing a decrease of -0.55% from the previous price.
Support and Resistance Levels The pivot point is 1121.07, with support levels at 1121.07, 1121.07, and 1121.07; resistance levels are also at 1121.07, 1121.07, and 1121.07.
Indicators Current RSI is 38.08, indicating a bearish trend as the historical values dropped significantly. ATR is at 1.27482, reflecting low volatility. The MACD shows a current value of -1.66978, with a bullish histogram suggesting potential buying pressure. The SAR is at 1136.47826, indicating the price is below this level, further supporting a bearish outlook.
Market Sentiment Given the price is below the pivot at 1121.07 and bearish indicators, a continued downward trend appears likely.
LLY Signals & Technical Analysis
Market Sentiment
Trend Indicators
Oscillators
Moving Averages
Pivot
About (lly) Eli Lilly and Company
Company Background
Eli Lilly and Company, publicly traded under the symbol LLY on the NYSE, is a global leader in the pharmaceutical industry. Founded in 1876 and headquartered in Indianapolis, Indiana, Eli Lilly focuses on the discovery, development, and manufacture of innovative medicines. The company has a rich heritage of pioneering scientific advancements and is renowned for its commitment to improving patients' lives through cutting-edge treatments in various therapeutic areas, including diabetes, oncology, immunology, and neuroscience.
Market Position
As one of the top pharmaceutical companies worldwide, Eli Lilly holds a strong market position driven by a diverse portfolio of products and a robust pipeline of new therapies. The company has established itself as a key player in the diabetes care market with its blockbuster medication, Trulicity, which has significantly contributed to its revenue streams. Additionally, Eli Lilly has made considerable strides in oncology with drugs such as Verzenio and Emgality, targeting specific patient populations and addressing unmet medical needs. Eli Lilly's strategic partnerships and collaborations further enhance its market presence and innovation capabilities.
Key Financial and Industry Highlights
In recent years, Eli Lilly has demonstrated impressive financial performance, with substantial growth in revenue fueled by the successful launch of new products and the expansion of existing therapies. The company reported a revenue increase of 20% year-over-year in its latest financial statements, showcasing strong demand for its innovative treatments. Furthermore, Eli Lilly has invested significantly in research and development, allocating approximately 25% of its revenue to R&D initiatives. This commitment to innovation has resulted in a rapidly expanding product pipeline, with several promising candidates in late-stage clinical trials. As the global pharmaceutical landscape continues to evolve, Eli Lilly is well-positioned to capitalize on emerging trends in personalized medicine and biotechnology, ensuring sustained growth and long-term shareholder value.
How to Buy or Trade Eli Lilly and Company Stock (LLY) with AvaTrade
Trading or investing in Eli Lilly and Company stock through AvaTrade starts with opening a verified trading account. After registration, complete the KYC verification process by submitting your ID and proof of address, then fund your account using a supported payment method such as bank transfer, debit card, or e-wallet. Once your funds reflect, log into the AvaTrade platform or mobile app and search for the ticker symbol LLY, which represents Eli Lilly and Company. Before placing a trade, review the live Eli Lilly and Company share price, market trend, spread, leverage options, and recent market news that could impact the stock price.
The next step is deciding whether you want to buy or sell Eli Lilly and Company stock. Traders expecting the price to rise typically open a Buy position, while traders expecting weakness in the sector may open a Sell position using CFDs. Enter your preferred trade size, then apply risk management tools such as a stop-loss to limit downside exposure and a take-profit order to secure profits automatically. After confirming the trade, monitor key drivers including Eli Lilly and Company earnings reports, product or service announcements, business segment performance, revenue growth, and overall stock market sentiment. Many traders also use technical indicators such as moving averages, RSI, and support/resistance levels available on the AvaTrade platform to improve timing and trading decisions.
Related Stocks


Sidebar rates
- <% signal.pair %>
 <% signals.active.Current.rate.substr(0,7) %>
