Prices Forecast: Technical Analysis
For today, the predicted closing price for USD/SGD is 1.2840, with a range of 1.2820 to 1.2860. Looking ahead to the week, the forecasted closing price is 1.2850, with a range of 1.2830 to 1.2870. The technical indicators suggest a neutral to slightly bullish sentiment, as the RSI is around 52, indicating that the market is neither overbought nor oversold. The ATR shows low volatility, suggesting that price movements may be limited in the short term. The price has been oscillating around the pivot point of 1.28, which indicates a balance between buyers and sellers. If the price breaks above the resistance level of 1.2860, we could see further upward momentum. Conversely, a drop below 1.2820 could signal a bearish trend. Overall, the market appears to be consolidating, and traders should watch for breakout opportunities.
Fundamental Overview and Analysis
Recently, USD/SGD has shown a tendency to fluctuate within a narrow range, reflecting mixed market sentiment. Factors influencing the asset’s value include the recent U.S. retail sales data, which showed a slight increase, indicating consumer spending resilience. Investor sentiment remains cautious due to potential interest rate decisions by the Federal Reserve, which could impact the USD’s strength. Additionally, geopolitical tensions and economic data releases from Singapore may also affect the SGD’s performance. Opportunities for growth exist as the Singapore economy continues to recover, but risks include potential regulatory changes and market volatility. Currently, USD/SGD appears fairly priced, with no significant overvaluation or undervaluation evident in the market.
Outlook for USD/SGD
The future outlook for USD/SGD remains cautiously optimistic, with potential for gradual appreciation in the coming months. Current market trends indicate a consolidation phase, with prices likely to remain within the established range unless significant economic data or geopolitical events occur. In the short term (1 to 6 months), we could see prices hover around the 1.2850 mark, influenced by U.S. economic performance and Singapore’s recovery. Long-term forecasts (1 to 5 years) suggest a potential upward trend if economic conditions improve and interest rates stabilize. However, external factors such as global economic shifts or trade tensions could significantly impact price movements. Traders should remain vigilant and adjust their strategies based on evolving market conditions.
Technical Analysis
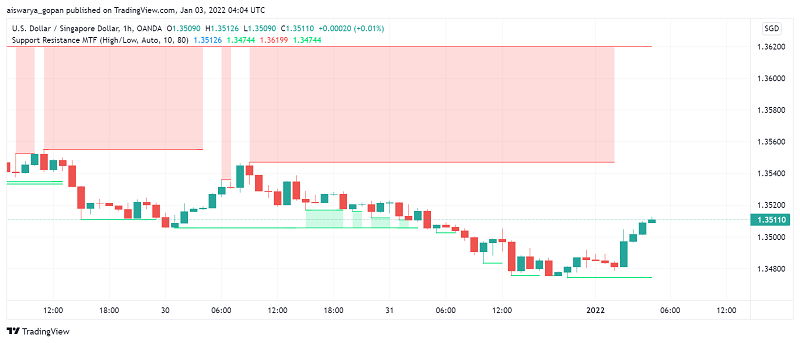
Current Price Overview: The current price of USD/SGD is 1.2822, slightly lower than the previous close of 1.2849. Over the last 24 hours, the price has shown a slight downward trend with low volatility, indicating a stable market environment. Support and Resistance Levels: The support levels are at 1.2800, 1.2780, and 1.2760, while resistance levels are at 1.2860, 1.2880, and 1.2900. The pivot point is at 1.2800, and the asset is currently trading just below this level, suggesting a potential for upward movement if it breaks above. Technical Indicators Analysis: The RSI is at 52.4288, indicating a neutral trend. The ATR is low at 0.0045, suggesting limited volatility. The ADX is at 22.6116, indicating a weak trend. The 50-day SMA is at 1.2770, and the 200-day EMA is at 1.2765, showing no significant crossover at this time. Market Sentiment & Outlook: Sentiment appears neutral, with price action hovering around the pivot point and the RSI indicating no strong bullish or bearish momentum.
Forecasting Returns: $1,000 Across Market Conditions
The table below outlines potential investment scenarios for USD/SGD, providing insights into expected returns based on different market conditions.
| Scenario | Price Change | Value After 1 Month |
|---|---|---|
| Bullish Breakout | +2% to ~$1.306 | ~$1,020 |
| Sideways Range | 0% to ~$1.282 | ~$1,000 |
| Bearish Dip | -2% to ~$1.256 | ~$980 |
FAQs
What are the predicted price forecasts for the asset?
The predicted daily closing price for USD/SGD is 1.2840, with a weekly forecast of 1.2850. These predictions are based on current technical indicators and market conditions.
What are the key support and resistance levels for the asset?
Key support levels for USD/SGD are at 1.2800, 1.2780, and 1.2760, while resistance levels are at 1.2860, 1.2880, and 1.2900. The asset is currently trading just below the pivot point of 1.2800.
What are the main factors influencing the asset’s price?
Factors influencing USD/SGD include U.S. economic data, particularly retail sales, and Singapore’s economic recovery. Investor sentiment and geopolitical events also play a significant role.
What is the outlook for the asset in the next 1 to 6 months?
The outlook for USD/SGD in the next 1 to 6 months is cautiously optimistic, with prices expected to hover around 1.2850. Economic conditions and market sentiment will be key drivers.
What are the risks and challenges facing the asset?
Risks for USD/SGD include potential regulatory changes, market volatility, and external economic factors. Traders should remain vigilant to these challenges.
Disclaimer
In conclusion, while the analysis provides a structured outlook on the asset’s potential price movements, it is essential to remember that financial markets are inherently unpredictable. Conducting thorough research and staying informed about market trends and economic indicators is crucial for making informed investment decisions.